Understanding Your Motivation Results: Evolution in Marlee Scoring
We're excited to share an evolution in how we present your motivation results. Whether you're familiar with our previous scoring or new to our assessments, this guide will help you understand your results and use them to support your growth.
- Author
 Bethany Cutmore Scott
.jpg)
What's Changed?
We've enhanced how we display and calculate your motivation results to make them even more intuitive and the insights even more impactful for you and your team. Marlee now uses normal distributions as Percentiles to compare your raw results to the local population. We have also launched beautiful team distribution Boards to visualize your team's combined motivations.
Understanding Key Terms
- Percentile: Your position relative to others in your working culture, expressed as the percentage of the population who score below you. For example, being in the 75th percentile for Goal Orientation means you are more motivated by goals than 75% of people in your culture.
- Working Population/Culture: The specific group your scores are compared against - typically people in the same country or region. This ensures your results are relevant to your professional context.
- Team Distribution: The pattern showing how your team's scores spread across the working culture's range. This helps you see if your team tends to cluster in certain areas or spread widely.
- Median: The middle point where 50% of results fall above and 50% fall below. This is the 50th percentile.
- Interquartile Range (IQR): The typical range around the median, consisting of half of the population (from the 25th to 75th percentile)
What's a Percentile?
Percentiles are most easily explained with a simple example. If you're in the 70th percentile for a particular motivation, this means you're more motivated by this factor than 70% of people in your working culture. Think of it like standing in a line of 100 people - you'd be ahead of 70 of them for this particular motivation.
The middle point, or median, is the 50th percentile. This means:
- If you're above 50, you're more motivated by this factor than most people in your culture
- If you're below 50, you're less motivated by this factor than most people in your culture
- If you're at 50, you're right in the middle
Translating Between Scoring Systems
If you're familiar with our previous scoring system, here's how it relates to percentiles:
- The median (typical) score is 50 in both systems.
- Previous scores around 0 translate to percentiles around 16
- Previous scores around 100 translate to percentiles around 84
- The extremely high or extremely low results are shown as decimals of a percent. For example, a score of 325 would translate to around the 99.99th percentile
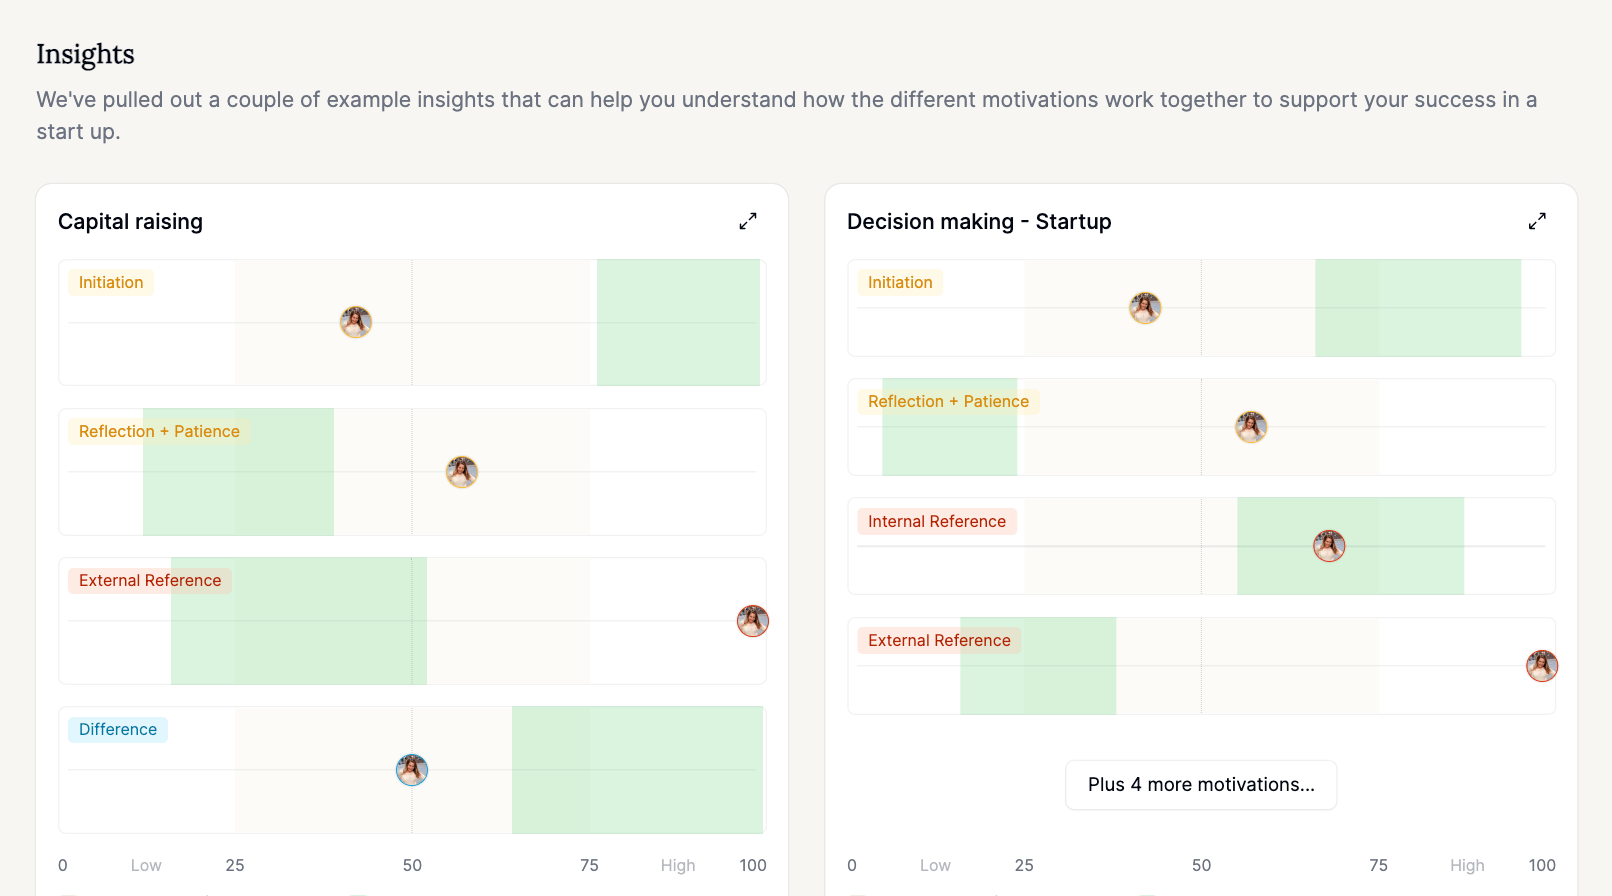
Reading A Marlee Results Graph
The visualisations show:
- The working culture's scale (0-100 percentiles) along the bottom
- Your team's distribution curve showing how your team's scores spread across this scale
- A grey shaded "typical range" for the working culture (25th to 75th percentiles), with a grey dotted line noting the median
- A coloured shaded "typical range" for your team (25th to 75th percentiles), with a coloured dotted line noting the median
- Your result marked by your avatar
Understanding Team Distributions
The curve on your results shows how your team's scores distribute across the working culture's percentiles. This helps you see:
- Where your team tends to cluster (the higher parts of the curve)
- How your team's pattern compares to the working culture (the distance between the two median lines, and the differences between the two interquartile ranges)
- How spread out the scores are, and therefore how varied your team is in their results (the width of the curve)
- Where your team's scores fall compared to the wider population
- Whether your team's motivational patterns differ from typical patterns in your culture
Why This Enhancement Matters
This evolution in our scoring system brings several benefits while maintaining the core strengths of our previous approach:
- More intuitive understanding of where you stand
- Easier comparison across different motivations
- The ability to quickly see in detail how your team compares to the culture
- More actionable insights for personal and team development
🌟 Explore our new Boards and tools to unlock personal and team insights.
Moving Forward Together
Whether you're seeing your results for the first time or transitioning from our previous system, these changes are designed to give you clearer, more actionable insights into your motivations.
Remember, your motivational profile is uniquely yours. These percentiles aren't about ranking - they're about understanding yourself better and using that understanding to thrive in your work environment.
Ready to explore your results?


